

Mise en place — why structure matters
I approach fleet data like a professional kitchen: everything prepped, labeled, and staged before the heat hits. If you handle logistics fleet management without a clear mise en place, reports become a jumble of guesses. The framework below sets the prep, the cook, and the plating so leaders see reliable results every shift.
Ingredients — what to collect (the essential metrics)
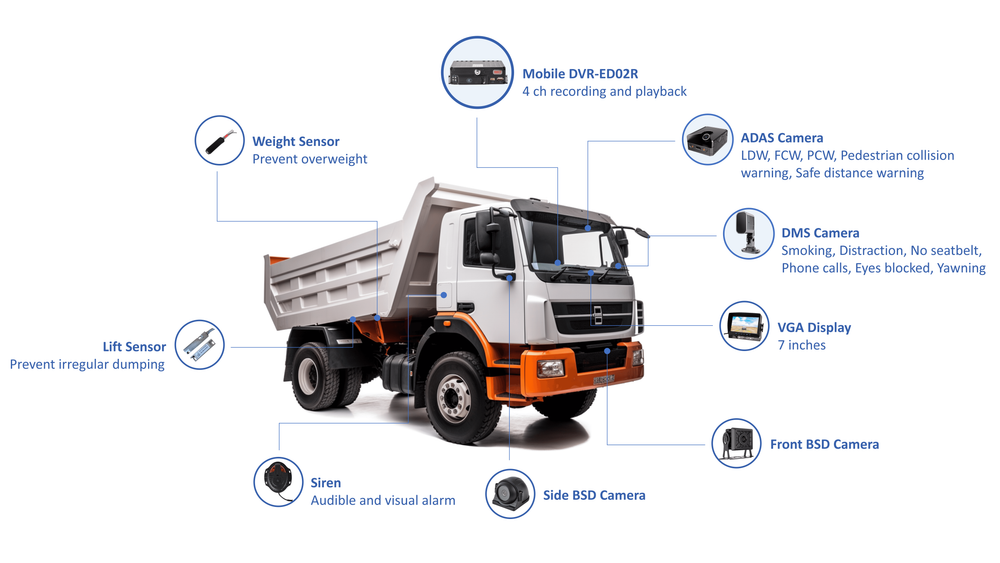
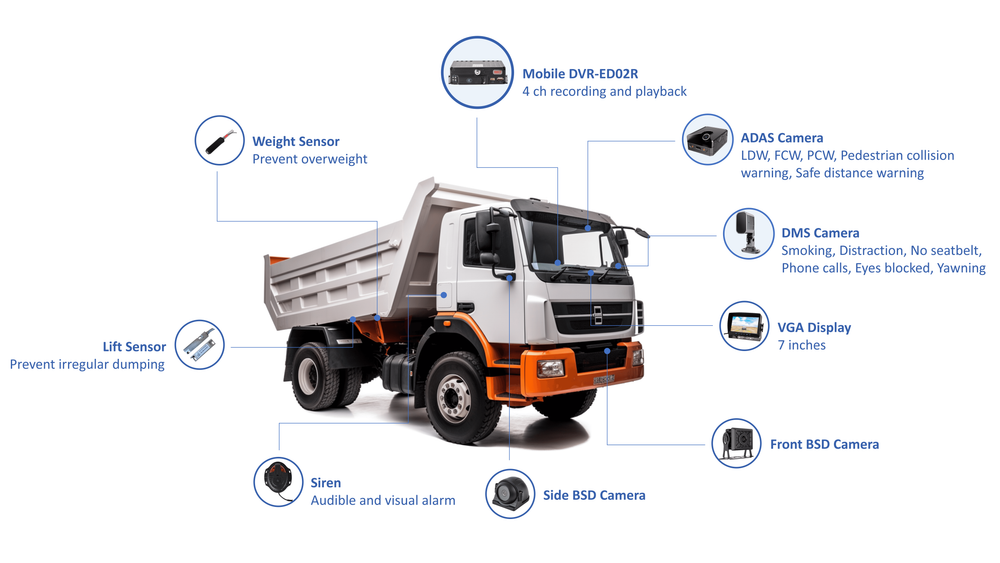
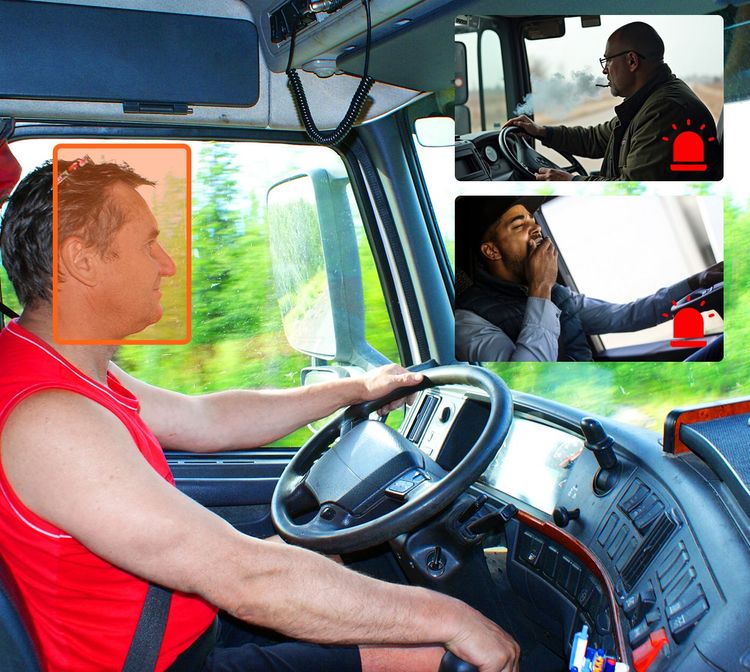
Pick only the ingredients that change the dish. Track these primary measures first:- Vehicle identification: VIN, unit ID, asset type.- Telemetry basics: GPS location (with accuracy), timestamp, odometer.- Performance: fuel consumption or energy per mile, average speed, idling minutes.- Utilization: hours in service, miles per day, load factor.- Maintenance: scheduled vs. unscheduled events, mean time between failures, maintenance cost per km.- Safety & behavior: harsh braking, acceleration, seatbelt events, incidents.- Delivery metrics: on-time percentage, route variance, dwell time at stops.- Environmental: CO2 or well-to-wheel energy usage where applicable.Collect these consistently; missing fields mean the recipe fails.
Method — how to capture and process without burning it
Treat data flow like a sauce that must be reduced to concentrate flavor. Decide sampling and storage early:- Sampling: GPS every 15–60 seconds for urban routes; longer intervals for long-haul to save bandwidth.- Sync clocks: all feeds must use UTC or a single fleet timezone to avoid skew.- Validate at ingestion: basic sanity checks for odometer jumps, impossible speeds, or null locations.- Normalize: convert units, map vehicle IDs to master records, tag vehicle role (delivery, service, spare).Real-world anchor: busy hubs such as the Port of Rotterdam expose edge cases — dense GPS reflections, frequent idle periods, and many quick location handoffs — so test your ingestion strategy in a high-traffic environment before scaling.
Plating — dashboards, reports, and who gets what
Presentation decides whether a report is eaten or left on the tray. Design views by role:- Operations dashboard (real-time): live unit map, exception list (delays, off-route, low battery).- Fleet manager report (daily): utilization, fuel/energy trends, top 10 maintenance alerts.- Finance & procurement (monthly): cost per km, lifecycle cost projections, replacement timing.- Safety & compliance (weekly): safety events, training follow-ups, inspection failures.For a control-room setup, transport fleet management platforms must integrate telematics, route data, and maintenance logs so exceptions trigger the right workflows and the plating stays consistent.
Recipe checks — quality rules and alerting
Never trust a single passive chart. Automate checks:- Data completeness rates per vehicle and field; flag below 95%.- Anomaly detection for sudden fuel spikes or odometer resets.- Drift alarms for GPS accuracy degradation.- Ownership mapping: detect units with missing master-data linkage.Set escalating alerts: immediate SMS for safety events, end-of-day digest for data gaps, weekly review for trends.
Common mistakes — things that ruin the dish
Experienced chefs learn by burning a few sauces. Avoid:- Over-reporting: dumping every metric into reports that no one reads.- Time-zone mismatch across telematics and back-end systems.- Relying on vendor defaults without testing in your operating conditions.- Ignoring firmware and device health; dead devices stop the data stream.- Treating dashboards as one-off; they need continuous calibration against business goals.
Tooling comparisons — a quick taste test
There are three sensible approaches; pick one that fits your kitchen:- OEM telematics: deep vehicle data, consistent formats; may lack flexibility.- Aftermarket providers: flexible integrations, faster rollout; vet device quality.- End-to-end platforms (telemetry + TMS + maintenance): fewer handoffs but weigh cost and lock-in.Evaluate on data fidelity, latency, device lifecycle support, and how easily exports feed BI tools. A pragmatic stack mixes a reliable telematics feed with a lightweight analytics layer you can iterate.
Common pitfalls in implementation
Quick fixes found in real kitchens:- Start with a pilot fleet and validate the full path: device → ingestion → normalization → dashboard.- Don’t hardcode thresholds; tune them from historical distributions.- Capture metadata: firmware version, SIM signal strength, and device battery as part of diagnostics.- Plan retention: raw telemetry short-term, aggregated metrics long-term for trend analysis.
Final plating — what good reporting delivers
When data is prepped, cooked, and plated with discipline, a few outcomes become visible: lower downtime, clearer replacement timing, fewer late deliveries, and measurable safety improvement. The framework above is a recipe you can execute, refine, and repeat; apply it to daily shifts and quarterly reviews and the results compound like a well-made stock. For fleets that need a steady, enterprise-grade kitchen, BSJ shows how consistent processes and clean feeds turn raw telemetry into decisions you can taste and trust.