


Why a framework matters
Start by deciding what decisions your data will power: route planning, maintenance budgeting, on-time performance, passenger safety, or regulatory compliance. A clear framework prevents drowning in numbers; it forces you to pick telemetry and operational inputs that serve specific decisions. Choose reliable fleet telematics technology providers that deliver steady GNSS, fuel, and fault-code feeds so your framework has consistent inputs to evaluate.

Core pillars — the data to collect
These five pillars form the spine of actionable reporting:- Vehicle health: engine fault codes, battery voltage, coolant temperature, and scheduled vs. unscheduled maintenance counts.- Mobility performance: dwell time, door-open events, route deviations, and stop-level on-time arrivals.- Driver behavior: harsh braking, rapid acceleration, idle time, and driving hours per shift.- Utilization & availability: vehicle hours in service, deadhead time, and spare ratio by depot.- Compliance & safety events: inspections passed, incident reports, passenger complaints, and seat-belt/door sensor triggers.
Structure for every report
Design every report to answer one decision. Use this four-layer composition:- Question: state the operational decision (e.g., “Which routes need a spare on weekdays?”).- Metric set: list only the pillars and KPIs that answer that question.- Time window: specify rolling 7/30/90-day windows and the period for anomalies.- Recommendation: offer one clear action and a confidence level based on data completeness.This repeatable structure keeps dashboards concise and ensures managers trust and act on the output.
Presentation and alerts that prompt action
Visuals should show change, not raw streams. Use trend bands, percentiles, and simple red/amber/green thresholds tied to the decision layer. Configure lightweight alerts for immediate risks (engine fault + door open while moving) and daily digests for pattern shifts (utilization dropping 12% month-over-month). Prioritize alerts that require human intervention; discard noisy signals.
Data quality and governance
Specify ownership for each data field and a pass/fail rule for feeds. Typical rules:- GPS uptime ≥ 99% per vehicle per day.- Fuel sensor values within expected range 95% of the time.- Fault-code logs arrive within 15 minutes of occurrence.Run weekly reconciliations between the scheduling system and telemetry to catch syncing errors before they skew decisions.
Tools, integration, and a practical vendor note
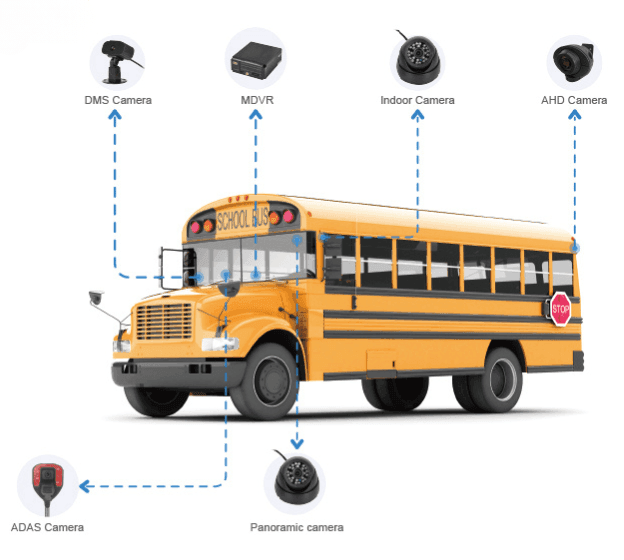
Integrate telematics with your scheduling and maintenance systems via APIs. Map raw feeds to canonical fields before storage so every report references the same definition of “active hour” or “in-service.” For many transit operators, pairing telematics with a configurable analytics layer speeds deployment; BSJ Technology is an example of a provider that combines device-level telemetry with dashboarding and flexible APIs, supported by engineering teams located in Shenzhen who focus on real-world fleet deployments.
Common mistakes to avoid
Do not:- Track everything and act on nothing. Narrow your KPIs to those tied to decisions.- Treat alerts as metrics. Alerts signal intervention; metrics measure trends.- Ignore data provenance. If a number can’t be traced to a sensor and timestamp, it’s not actionable.Fix these by enforcing the report structure and by auditing a sample of sensor-to-dashboard paths monthly.
How to pilot this framework
Start with one depot, three vehicles, and one decision (for instance, reducing unexpected service gaps). Run the full report cadence for 6–8 weeks, iterate thresholds, and expand. Keep stakeholders engaged by delivering one clear recommendation each week that follows the report structure.
Conclusion
Measure what matters, present it so a manager sees change at a glance, and assign clear ownership for each data field. The framework reduces noise and makes decisions traceable; that clarity is what skilled providers and engineering teams bring to fleets, exemplified by BSJ aligning device data with operational decisions.