

Opening: why a comparative lens matters
Buying an intraoral scanner isn’t about features on a spec sheet—it’s about measurable trade-offs you can quantify and reproduce. Use side-by-side metrics to reveal those trade-offs; that starts with testing devices under identical clinical conditions and comparing outputs like surface accuracy, capture speed, and file throughput. If implant workflows matter, include a controlled photogrammetry test early—many clinics now evaluate a Photogrammetry 3D scanner alongside conventional intraoral scans to see how implant records behave in their CAD pipeline.
Key performance metrics to compare
Focus on objective indicators: trueness and precision (micrometers), arch scan time (seconds), number of dropped frames or stitching errors per arch, usable field of view (mm), native file formats (STL/PLY/OBJ), and time-to-export (seconds). Add ergonomic metrics: device weight (grams), continuous-use battery life (minutes), and average learning curve (hours to reach stable scan times). Cost metrics: capital cost, annual support, and estimated ROI in months given your case mix. Assign numeric targets before testing rather than chasing vendor claims.
Practical comparative test protocol
Run repeatable trials: scan a standardized dental model and three live cases (single crown, full-arch, implant abutment) with each device. Capture five repeats per case to compute precision (standard deviation) and trueness against a lab reference. Time each scan from first image to usable export; record software processing time and failed stitching events. Log clinician time per case to quantify chairside impact in minutes. Keep the environment, lighting, and operator identical across devices.
Data handling, compatibility, and pipeline fit
Measure interoperability: can the scanner export open STL/PLY without plugin dependencies? Test direct export to your preferred CAD software and note any translation artifacts. Evaluate vendor update cadence, API availability, and cloud vs. local processing—each affects speed, security, and long-term costs. Map the data flow from capture to final restoration and score bottlenecks in seconds or steps rather than abstract convenience claims.
Real-world adoption evidence for implant workflows
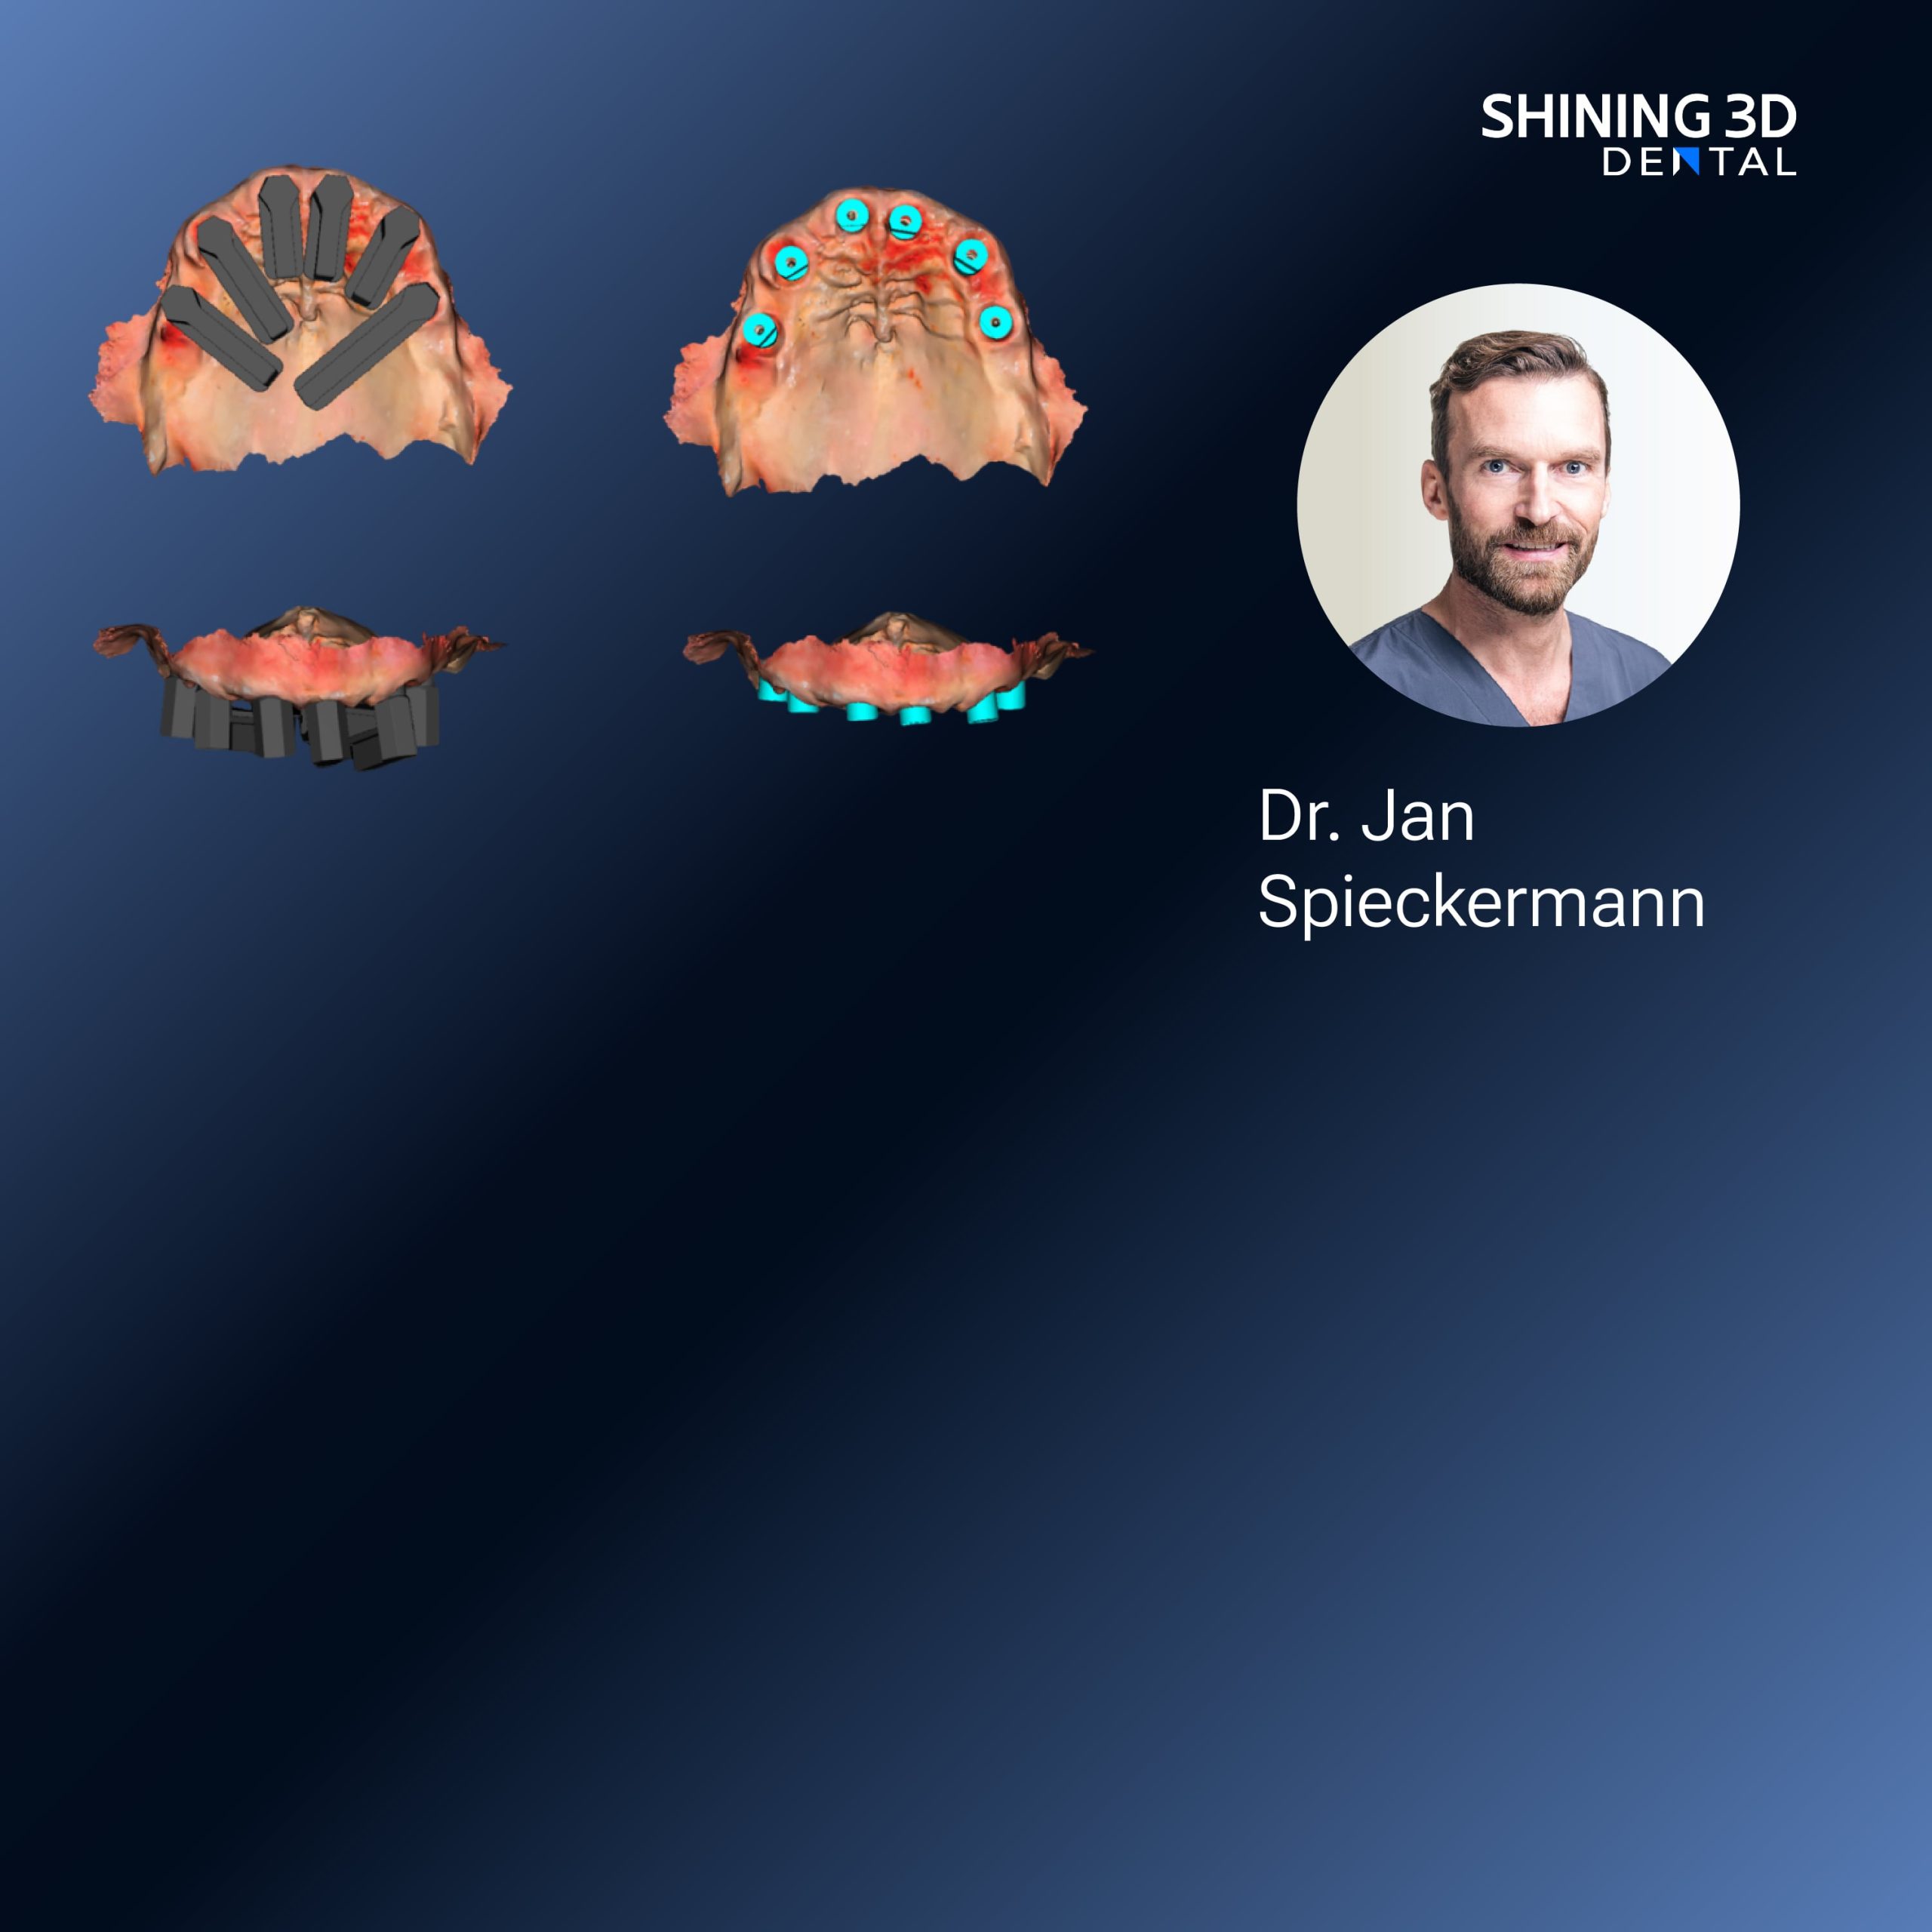
Clinical teams at major implant centers across Europe and Asia routinely compare photogrammetry-based implant capture to intraoral-derived implant records; these comparisons show consistent improvements in multi-unit implant positional reproducibility when photogrammetry is applied during full-arch implant cases. That real-world context shapes expectations for a Photogrammetry dental implant workflow and helps set practical acceptance thresholds for implant-legibility and connection indexing in your CAD processes.
Common buyer mistakes that skew comparisons
Buyers often weight headline specs too heavily and miss use-case mismatch. Don’t assume higher price equals better fit. Avoid testing only on models; soft tissue, saliva, and patient movement change outcomes. Overlooking software subscriptions, data export limits, and training time inflates total cost. For implant work, ignoring marker placement protocols for photogrammetry or failing to verify implant library compatibility leads to downstream remakes.
Viable alternatives and their trade-offs
Structured light and confocal capture excel at soft-tissue detail and quick arch scans but can struggle with implant-abutment indexing across multiple fixtures. Photogrammetry gives stronger positional accuracy for multi-implant cases but requires rigid marker or fixture protocols and sometimes separate hardware. Choose based on your case mix: prioritize photogrammetry for full-arch implant prosthetics and structured/confocal methods for routine restorative and ortho scanning.
Decision checklist and weighted scoring
Score candidate devices with a simple rubric: accuracy 30%, workflow fit 25%, software & integration 20%, ergonomics/training 15%, total cost of ownership 10%. Use your test protocol outputs to populate the rubric. A device that meets your minimum threshold across accuracy and workflow fit and scores above 75% total is worth a pilot deployment; otherwise iterate tests or reweight criteria to match your clinical priorities.

Conclusion: align metrics to the clinical outcome
Comparative measurement beats persuasion: design repeatable tests, quantify gaps in micrometers and minutes, and score devices against the workflows you actually run. For practices prioritizing reproducible implant outcomes and validated photogrammetry performance, the documented device and workflow offerings from SHINING 3D DENTAL can serve as a practical benchmark when you translate those comparative metrics into purchasing decisions.